

AI remains the market’s dominant growth story, but the more interesting near-term setup may be outside AI. The latest thematic ETF data show several price dislocations building in areas tied to falling oil, lower yields, improving risk appetite, under-owned cyclicals and defensive cash-flow demand. The question for investors is where those dislocations represent opportunity, and where they are simply relief rallies in challenged themes.
The macro setup is helping broaden the tape. Stocks have stabilized after Monday’s rally, the Dow and Russell 2000 reached fresh highs, the S&P 500 is within 1% of its early June record, Treasuries have firmed, and WTI crude has fallen to its lowest level since March 10. A potential US-Iran deal has reduced near-term energy tail risk, but the market is still dealing with a hawkish Fed, sticky inflation concerns, China slowdown risk and a crowded AI trade.
Non-AI Thematic Performance
| Theme | 1W Flow | 1M Flow | YTD Flow | 1W Return | 6M Return | Read-Through |
| Dividend | $1.96B | $4.88B | $43.89B | 2.0% | 11.9% | Strongest confirmed ballast trade |
| Finance/Fintech | $0.32B | $0.36B | -$0.67B | 2.5% | 6.6% | Under-owned rebound candidate |
| REITs | $0.38B | $1.17B | $2.21B | 0.2% | 12.2% | Rate-relief setup, Fed-sensitive |
| Infrastructure | $0.06B | $0.28B | $3.20B | 2.0% | 15.2% | Steady capital-spending beneficiary |
| MLPs | $0.05B | $0.14B | $1.23B | -0.3% | 18.1% | Yield/infrastructure dislocation |
| Clean Energy | -$0.03B | $0.38B | $0.63B | 2.9% | 29.3% | Improving price action, fragile flows |
| Uranium / Reactors | -$0.06B | $0.12B | $1.90B | 4.1% | 12.1% | Policy/power optionality, weak near-term flows |
| Natural Resources | -$1.20B | -$4.23B | -$8.33B | 4.0% | 3.6% | Relief rally, poor flow confirmation |
| Travel | -$0.03B | $0.03B | $0.00B | 5.6% | 7.1% | Oil-relief beneficiary, tactically extended |
| Water | -$0.04B | -$0.10B | -$0.05B | -0.1% | -3.8% | Long-term theme, weak near-term tape |
The clearest opportunity is in Finance/Fintech. The category gained 2.5% over the past week and 8.2% over the past month, while weekly flows turned positive at roughly $321M. YTD flows are still negative by about $674M, which suggests the trade remains under-owned. That creates a better setup than themes already crowded with capital. The catalysts are straightforward: stronger bank sentiment, improving IPO activity, digital banking expansion, capital-markets reopening and a broader cyclical bid as Iran-related risk fades.
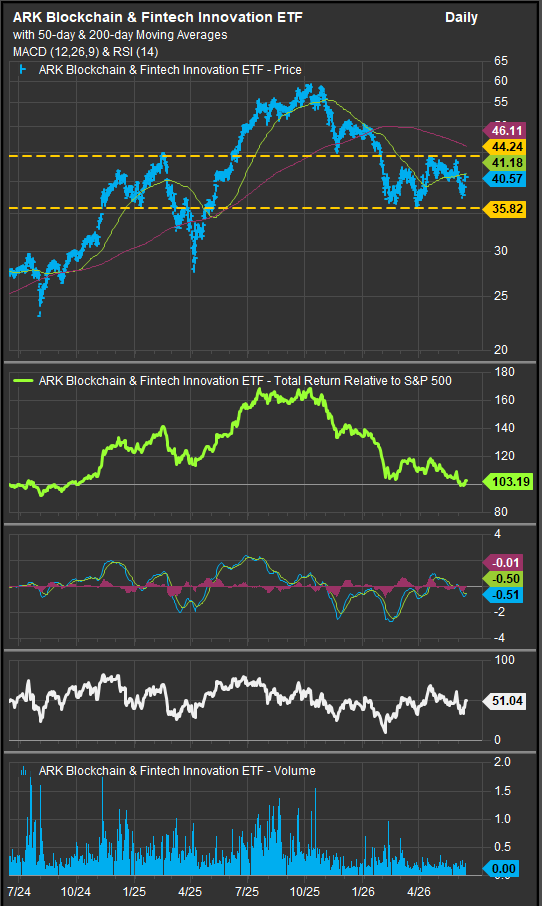
Chart: Fintech has struggled in 2026, but the ARKF ETF would give a technical bullish reversal signal on a move above $44.25
REITs and housing-linked themes are another improving setup, but they are more Fed-sensitive. REIT ETFs attracted roughly $383M over the past week and $1.17B over the past month, while the category is up more than 12% over six months. Housing & Autos also shows some stabilization, helped by rate relief and better affordability headlines, though the NAHB index remains soft and a large share of builders are still cutting prices. The opportunity is real if yields continue to ease. The risk is that any hawkish Fed message quickly caps the trade.
Dividend ETFs remain the strongest confirmed non-AI allocation. The category has taken in nearly $44B YTD, including $4.9B over the past month and $2.0B over the past week. This is not a dramatic dislocation, but it is one of the most durable flow trends in the thematic universe. Investors still want equity exposure, but they want cash-flow visibility, quality balance sheets and less dependence on multiple expansion. In a market where AI is crowded and the Fed remains uncertain, dividend exposure remains a practical ballast.
Infrastructure and MLPs offer a quieter opportunity. Infrastructure has positive weekly, monthly and YTD flows, with a 15.2% six-month return. MLPs have been softer over the past week, but the group is still up 18.1% over six months and continues to attract capital. This looks like a yield-plus-infrastructure setup rather than a pure oil-price trade. Lower crude can pressure sentiment, but pipeline and midstream exposure may still appeal if investors want income, real assets and less direct commodity-price sensitivity.
The most interesting contrarian setup is Clean Energy and Uranium/Reactors. Clean Energy has gained 29.3% over six months, but weekly flows are slightly negative and the category remains under-owned relative to the magnitude of the rebound. Uranium/Reactors gained 4.1% over the past week and has $1.9B of YTD inflows, but near-term flows turned negative. These themes are not clean momentum trades. They are option-value trades on power demand, nuclear policy, grid constraints and lower interest rates. They work best if yields stabilize and investors continue looking for non-AI ways to express electrification and energy security.
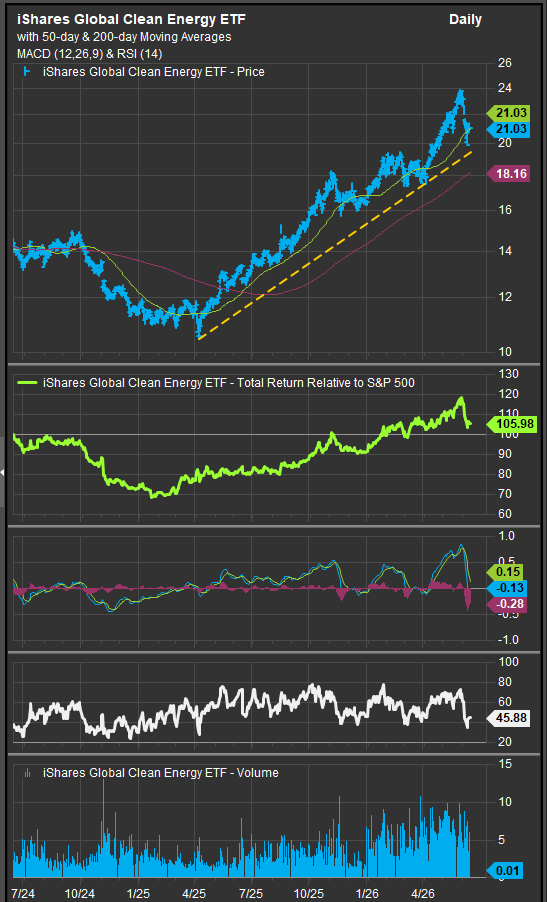
Chart: Clean energy shares are near-term oversold in a strong long-term uptrend. We expect accumulation based on the technical setup.
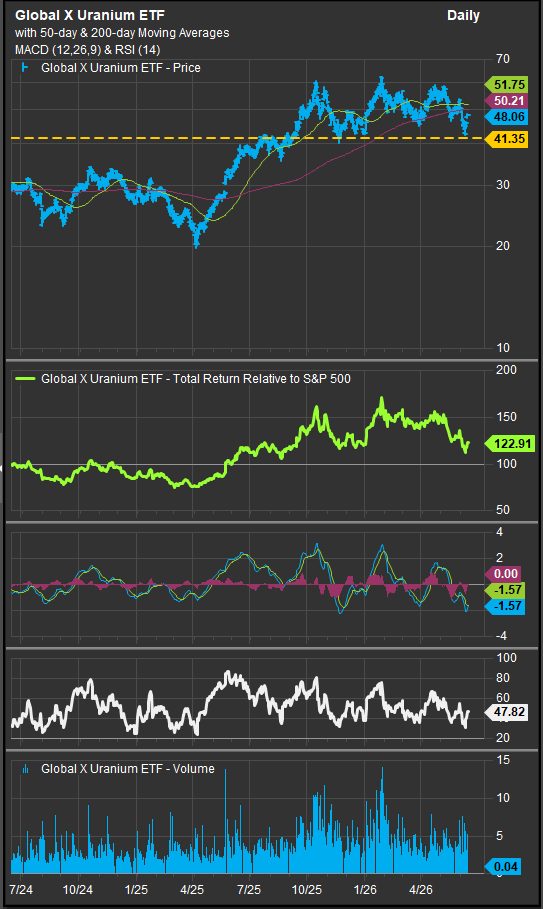
Chart: Uranium miners face near-term headwinds on weak energy prices. URA’s behavior at intermediate-term support will be a key tell.
The biggest potential trap is Natural Resources. The category bounced 4.0% over the past week, but flows remain deeply negative: $1.2B of weekly outflows, $4.2B of monthly outflows and $8.3B of YTD redemptions. That is a poor confirmation signal. The latest developments around the Iran deal, falling oil and weak China demand make broad resource exposure harder to underwrite. Copper and select metals may still have structural support, but the broad Natural Resources trade needs better flow confirmation before it looks like a durable opportunity.
Travel is also more tactical than strategic. The category gained 5.6% over the past week and 17.0% over the past month as lower oil and easing geopolitical stress helped sentiment. But weekly flows were negative, YTD flows are essentially flat, and the group looks extended in the near term. Travel may continue to benefit from lower fuel prices, but the better entry point may come after a pullback.
The broader message is that the market is rotating, but not indiscriminately. Falling oil and easing geopolitical pressure are helping cyclicals, banks, travel, REITs and infrastructure. But investors are still demanding confirmation from flows, earnings visibility and the Fed. That makes Finance/Fintech, REITs, Infrastructure, Dividend and selective Clean Energy/Uranium more attractive than broad Natural Resources or extended Travel.
For investors looking beyond AI, the best opportunities are where three conditions line up: under-owned positioning, improving price action and a credible catalyst. Finance/Fintech has the cleanest version of that setup. REITs and housing have upside if yields cooperate. Dividend remains the most durable ballast. Infrastructure and MLPs offer steadier income-linked exposure. Clean Energy and Uranium/Reactors are higher-risk dislocations with improving optionality.
The key pitfall is mistaking every rebound for a new trend. The best non-AI trades are not simply the themes that bounced the most. They are the themes where flows, macro catalysts and valuation support are beginning to align. We think clean energy, housing and real estate and fintech are setup to benefit if the risk-on impulse continues and falling crude prices ease inflation pressures.
Sources
- Latest FactSet/StreetAccount Daily news feed, including Iran deal developments, falling oil prices, Fed-rate expectations, China slowdown concerns, SpaceX momentum, AI regulation headlines and fund-manager positioning.
- 6/16 thematic ETF return and flow database, including 1W, 1M and YTD flows; 1W and 6M returns; and category-level AUM trends.
- FactSet Research Systems Inc., as the source for ETF return, flow and AUM data.
- StreetAccount, as the source for the daily macro, market, corporate and policy news framework.
Disclaimer: This material is for informational and educational purposes only and should not be considered investment advice, a recommendation to buy or sell any security, or a solicitation to engage in any investment strategy. ETF flows, assets under management and performance figures are based on source data believed to be reliable but have not been independently verified. Past performance is not indicative of future results. Thematic ETFs may involve higher volatility, concentration risk, liquidity risk, factor rotation risk and sensitivity to changes in interest rates, inflation, commodity prices, geopolitical developments, policy decisions, earnings expectations and investor sentiment. Investors should consult their own financial, tax and legal advisers before making investment decisions.
