July Review
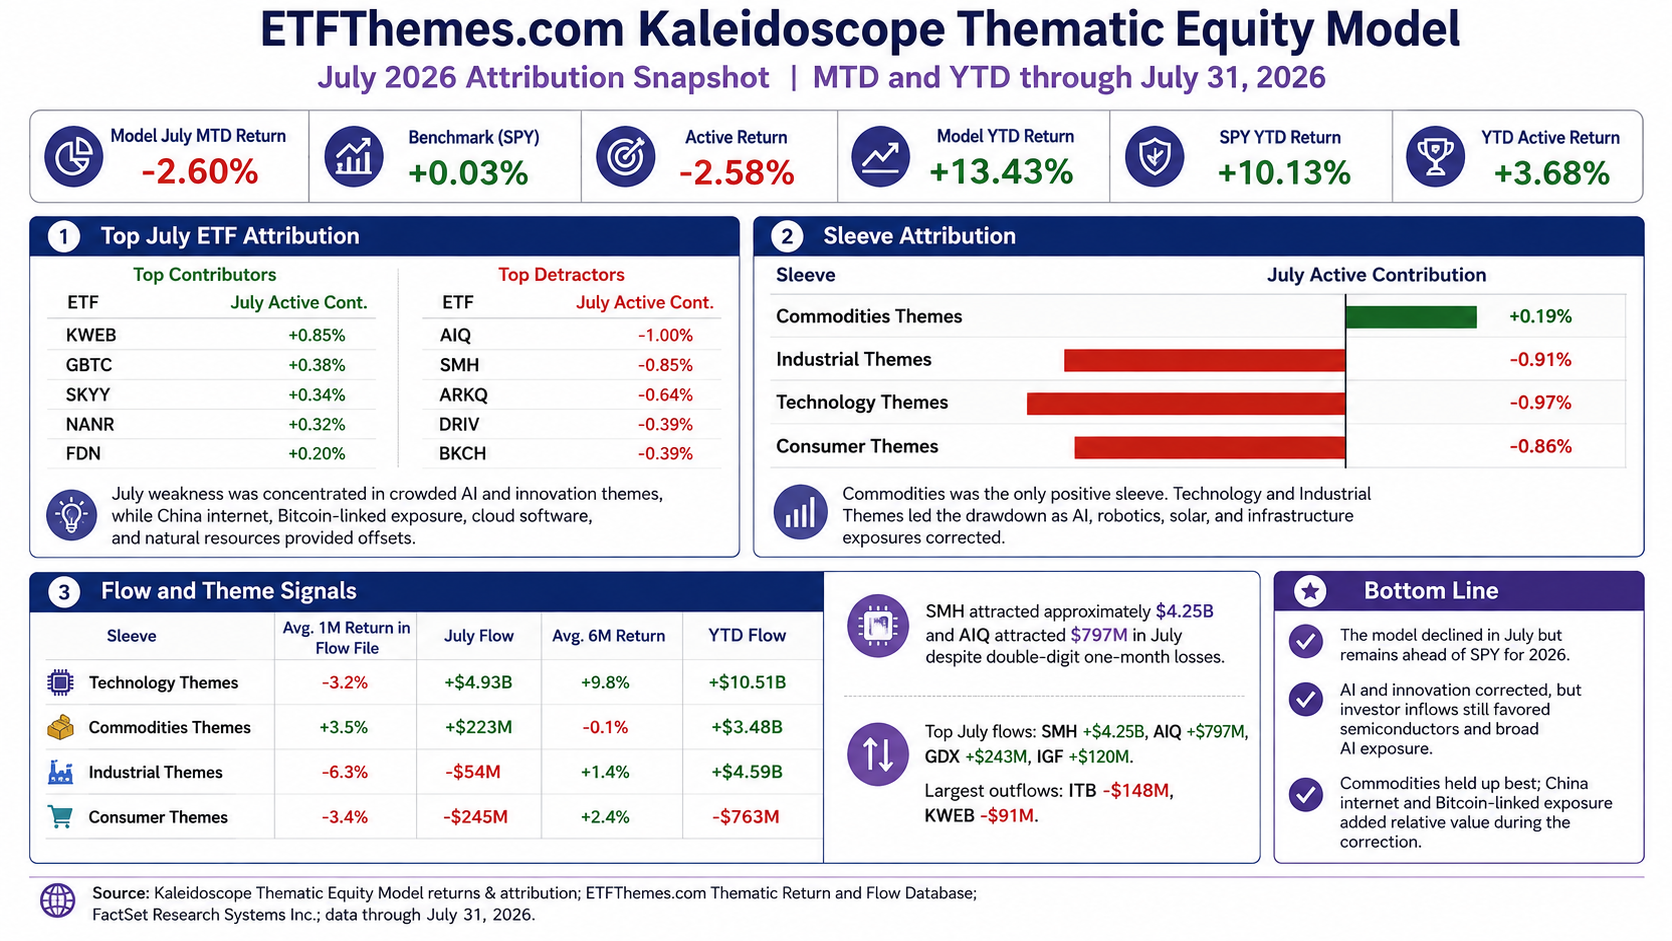
The Kaleidoscope Thematic Equity Model declined -2.60% in July versus SPY up 0.03%, producing -2.58% of active underperformance. July extended June’s setback and reduced the model’s year-to-date lead, but the sources of weakness became more concentrated. Artificial intelligence, semiconductors, autonomous technology, electric vehicles, blockchain equities, solar, and other capital-intensive growth themes drove the drawdown.
The positive side of the month was a rotation into KWEB, GBTC, SKYY, NANR, FDN, CIBR, COPX, and ESPO. China internet, Bitcoin-linked exposure, cloud computing, natural resources, internet platforms, cybersecurity, copper miners, and gaming all added relative value. The result was a month in which the model’s diversified thematic structure provided some offsets, but not enough to overcome the AI and innovation selloff.
The market backdrop explains the split. A global semiconductor rout accelerated after China’s Moonshot AI released a lower-cost model that intensified questions about the returns on U.S. AI spending. Late-month results from Microsoft and Amazon then showed that cloud and AI demand remained strong, providing fundamental support after the correction. The flow data captured that tension: investors added heavily to SMH and AIQ even as both posted double-digit one-month losses.
Market Backdrop
July was defined by an AI valuation reset followed by late-month fundamental confirmation. Reuters reported that the semiconductor index entered a bear market during the mid-July selloff as investors reassessed crowded positioning and the return on hyperscaler capital spending after Moonshot AI’s new model. That environment directly pressured SMH, AIQ, ARKQ, DRIV, and other innovation exposures.
The earnings evidence remained constructive. Microsoft reported 43% Azure growth in its June quarter, while Amazon reported 37% AWS growth, its fastest rate in 18 quarters. Amazon also said its AI and chips businesses each exceeded a $25 billion annual revenue run rate. Those results support the model’s long-term AI thesis, but they came with continued capital intensity: Amazon’s trailing 12-month free cash flow fell to a $7.6 billion outflow as property and equipment spending increased.
The macro environment remained restrictive for long-duration themes. The Federal Reserve held the federal funds target at 3.50%-3.75% on July 29, with three officials preferring a 25-basis-point increase. Second-quarter GDP grew at a 1.5% annual rate, but real final sales to private domestic purchasers increased 3.9%, showing resilient private demand. June core PCE inflation was 3.3% year over year. This combination supports capital investment but keeps discount rates elevated.
Higher rates and financing costs help explain weakness in ITB, TAN, XBI, DRIV, and parts of the industrial sleeve. New-home sales were still 5.6% below year-ago levels in June, with 9.3 months of supply, while the Fed’s persistent inflation concern limited expectations for near-term monetary relief.
China internet was a separate story. Beijing pledged to accelerate already-budgeted infrastructure spending and provide incremental support without launching a broad stimulus program. That helped KWEB’s price performance, but continued ETF outflows suggest investors remain cautious about property weakness, domestic demand, and the durability of the policy response.
Model Interpretation
July was a difficult relative month, but the attribution does not invalidate the model’s thematic structure. The drawdown was concentrated in themes that had benefited most from first-half AI and momentum leadership. The model’s year-to-date advantage remains positive because semiconductors, cybersecurity, AI, blockchain equities, natural resources, biotech, and infrastructure generated substantial earlier gains.
The most constructive July signal was flow behavior. Large inflows into SMH and AIQ during double-digit declines indicate that investors viewed the correction as an accumulation opportunity. Amazon and Microsoft earnings added fundamental confirmation that cloud demand, AI consumption, and capacity constraints remain real.
The challenges are equally clear. AI infrastructure spending is consuming free cash flow, the Federal Reserve remains restrictive, and semiconductor positioning can still unwind violently. Industrial themes need better breadth: GRID, PAVE, ARKX, and TAN must stabilize for the model’s physical-infrastructure thesis to reassert itself. Consumer Themes need improvement in housing, fintech, biotech, and crypto equities rather than reliance on isolated gains from GBTC or gaming.
The strongest forward setup remains in areas where demand, flows, and commercial evidence overlap: semiconductors after stabilization, AI platforms with visible monetization, cybersecurity, cloud infrastructure, natural resources, copper, and global infrastructure. China internet has improving price momentum but still lacks flow confirmation. Solar, home construction, and speculative autonomous technology remain highly sensitive to rates and financing conditions.
Bottom Line
The Kaleidoscope Thematic Equity Model declined -2.60% in July versus SPY up 0.03%, producing -2.58% of active underperformance. AIQ, SMH, ARKQ, DRIV, BKCH, XBI, TAN, and ARKX were the main detractors. KWEB, GBTC, SKYY, NANR, FDN, CIBR, COPX, and ESPO provided the principal offsets.
Through July, the model remained ahead of SPY, returning +13.43% versus +10.13% and retaining +3.68% of active outperformance. Technology Themes remain the main source of year-to-date alpha, while Consumer Themes remain the primary sleeve-level drag.
The July flow data show that investors did not abandon AI. They added approximately $5.05 billion to SMH and AIQ combined during a sharp correction. The model’s next phase depends on whether that capital is followed by price stabilization and broader participation from electrification, infrastructure, biotech, housing, and other secondary themes.
Model Performance and Attribution

July’s attribution was dominated by AIQ, SMH, and ARKQ, which together detracted approximately 2.49 percentage points. The decline reflected a valuation and positioning reset across AI infrastructure and autonomous technology after a powerful first-half advance. DRIV, BKCH, XBI, TAN, ARKX, ITB, URA, GRID, and PAVE added to the pressure.
The largest positive contributor was KWEB at +0.85%, followed by GBTC at +0.38%, SKYY at +0.34%, and NANR at +0.32%. The mix shows that July was not a uniform risk-off month. China internet, Bitcoin-linked exposure, cloud software, and natural resources all produced relative gains while the most crowded AI and high-beta themes corrected.
Note: ETF-level active contributions may not sum exactly to reported active return because of compounding interaction across holdings.
July Sleeve Attribution
| Sleeve | Holdings | July Active Contribution |
| Commodities Themes | NANR, COPX, GDX, MLPX, URA | +0.19% |
| Industrial Themes | GRID, ARKX, PAVE, IGF, TAN, PHO | -0.91% |
| Technology Themes | AIQ, ARKQ, CIBR, SKYY, SMH, KWEB, FDN | -0.97% |
| Consumer Themes | XBI, ARKF, GBTC, BKCH, ITB, DRIV, ESPO, PEJ | -0.86% |
Commodities Themes were the only positive sleeve, adding +0.19%. NANR and COPX provided the main support, while GDX and MLPX were close to neutral and URA detracted. The sleeve benefited from stronger natural-resource and copper exposure during a month of elevated geopolitical and supply-chain risk.
Technology Themes detracted -0.97%, narrowly more than Industrial Themes. AIQ, ARKQ, and SMH overwhelmed positive attribution from KWEB, SKYY, FDN, and CIBR. Industrial Themes lost -0.91% as solar, space, smart-grid, and infrastructure exposure weakened. Consumer Themes detracted -0.86% as DRIV, BKCH, XBI, and ITB offset gains from GBTC, ARKF, ESPO, and PEJ.
Year-to-Date 2026 Review
The model remains ahead for 2026. Through July, the Kaleidoscope Thematic Equity Model returned +13.43% versus SPY up 10.13%, producing +3.68% of active outperformance. July reduced the active lead from the first half, but the portfolio still holds a meaningful advantage over the benchmark.
Year-to-date alpha remains anchored by semiconductors, cybersecurity, blockchain equities, robotics and AI, natural resources, biotechnology, copper miners, smart-grid infrastructure, cloud computing, and autonomous vehicles. The principal offsets remain Bitcoin-linked exposure, fintech, China internet, gaming, broad internet platforms, and selected rate-sensitive themes.
Year-to-Date ETF Attribution
| Top YTD Contributors | Theme | YTD Active Contribution |
| SMH | Semiconductors | +2.43% |
| CIBR | Cybersecurity | +1.11% |
| BKCH | Blockchain Equities | +1.10% |
| AIQ | Robotics & AI | +1.05% |
| NANR | Natural Resources | +0.78% |
| XBI | Biotechnology | +0.68% |
| COPX | Copper Miners | +0.42% |
| GRID | Electrification / Smart Grid | +0.27% |
| PAVE | U.S. Infrastructure | +0.27% |
| SKYY | Cloud Computing | +0.26% |
| YTD Detractors | Theme | YTD Active Contribution |
| GBTC | Bitcoin-Linked Exposure | -1.37% |
| ARKF | Fintech | -1.05% |
| KWEB | China Internet | -0.88% |
| ESPO | Gaming & Esports | -0.31% |
| FDN | Internet Platforms | -0.28% |
| ARKQ | Autonomous Technology & Robotics | -0.21% |
| ITB | Home Construction | -0.20% |
| GDX | Gold Miners | -0.13% |
| PHO | Water | -0.08% |
| URA | Uranium | -0.05% |
Year-to-Date Sleeve Attribution
| Sleeve | Holdings | YTD Active Contribution |
| Technology Themes | AIQ, ARKQ, CIBR, SKYY, SMH, KWEB, FDN | +3.49% |
| Commodities Themes | NANR, COPX, GDX, MLPX, URA | +1.03% |
| Industrial Themes | GRID, ARKX, PAVE, IGF, TAN, PHO | +0.56% |
| Consumer Themes | XBI, ARKF, GBTC, BKCH, ITB, DRIV, ESPO, PEJ | -0.91% |
Technology Themes remain the primary source of year-to-date alpha at +3.49%, led by SMH, CIBR, AIQ, SKYY, and the model’s earlier gains in AI infrastructure. Commodities Themes contributed +1.03%, while Industrial Themes added +0.56%.
Consumer Themes remain the weak sleeve at -0.91%. Positive attribution from BKCH, XBI, DRIV, and PEJ has been more than offset by GBTC, ARKF, ITB, and ESPO. The sleeve continues to contain some of the portfolio’s most divergent exposures, spanning crypto, biotech, fintech, housing, autos, gaming, and leisure.
Thematic ETF Performance and Flow Trends
According to the ETFThemes.com Thematic Return and Flow Database, using FactSet Research Systems Inc. data through July 31, returns and flows diverged sharply. Technology Themes declined on average, but attracted the largest inflows because investors added to semiconductors and broad AI exposure during the correction. Commodities Themes produced the strongest average return and positive flows, while Industrial and Consumer Themes experienced net redemptions.
Flow totals reflect available ETF flow fields in the supplied database; funds with unavailable data are excluded. The source file’s KOPX row was treated as the model’s COPX copper-miners exposure for flow context. URA and GBTC were not present in the July thematic flow file. TAN appeared in the source’s uranium-reactor grouping but was treated here according to its model role as solar / clean-energy exposure.
| Sleeve | Avg. 1M Return in Flow File | July Flow | Avg. 6M Return | YTD Flow |
| Technology Themes | -3.2% | +$4.93B | +9.8% | +$10.51B |
| Commodities Themes | +3.5% | +$223M | -0.1% | +$3.48B |
| Industrial Themes | -6.3% | -$54M | +1.4% | +$4.59B |
| Consumer Themes | -3.4% | -$245M | +2.4% | -$763M |
Technology flows were the most important signal. SMH attracted approximately $4.25 billion and AIQ attracted $797 million even as the funds declined 17.84% and 10.55%, respectively. This was aggressive dip-buying rather than broad capitulation. The flow support suggests investors continued to believe in the long-term AI demand cycle while reducing the price they were willing to pay for near-term growth.
Commodities showed the best alignment between performance and available flows. NANR gained 7.46%, COPX rose 3.29%, GDX added 1.76%, and MLPX gained 1.62% in the flow file. GDX attracted $243 million, while the copper-miners row retained nearly $2.48 billion of year-to-date inflows despite a small July redemption.
The weakest flow profiles remained in home construction, China internet, solar, space, blockchain, autonomous technology, and fintech. Several of these were performance-flow divergences. KWEB gained 14.67% but lost $91 million, showing that the China rally had not yet developed into a durable U.S.-listed ETF allocation trend.
Top July Flow Winners and Losers
| Top July Flow ETFs | Theme | July Flow | 1M Return |
| SMH | Semiconductors | +$4.25B | -17.84% |
| AIQ | Robotics & AI | +$797M | -10.55% |
| GDX | Gold Miners | +$243M | +1.76% |
| IGF | Global Infrastructure | +$120M | +0.60% |
| Largest July Outflow ETFs | Theme | July Flow | 1M Return |
| ITB | Home Construction | -$148M | -8.62% |
| KWEB | China Internet | -$91M | +14.67% |
| TAN | Solar / Clean Energy | -$83M | -15.74% |
| ARKX | Space & Defense Innovation | -$68M | -11.05% |
| BKCH | Blockchain Equities | -$46M | -8.99% |
| ARKQ | Autonomous Technology & Robotics | -$35M | -13.80% |
| PEJ | Leisure & Entertainment | -$24M | +0.72% |
| COPX | Copper Miners | -$21M | +3.29% |
The July flow tables reinforce the month’s central tension. Investors used the selloff to add to SMH and AIQ, while withdrawing from ITB, TAN, ARKX, BKCH, and ARKQ. KWEB was the clearest return-flow disconnect: price performance was strong, but investors continued to redeem shares.
Year-to-Date Flow Winners and Losers
| Top YTD Flow ETFs | Theme | YTD Flow | 6M Return |
| SMH | Semiconductors | +$10.40B | +33.57% |
| PAVE | U.S. Infrastructure | +$2.73B | +10.74% |
| COPX | Copper Miners | +$2.48B | -5.94% |
| IGF | Global Infrastructure | +$1.24B | +5.48% |
| AIQ | Robotics & AI | +$776M | +12.93% |
| GDX | Gold Miners | +$617M | -18.49% |
| TAN | Solar / Clean Energy | +$439M | -7.45% |
| MLPX | Midstream / Energy Infrastructure | +$383M | +17.00% |
| Largest YTD Outflow ETFs | Theme | YTD Flow | 6M Return |
| KWEB | China Internet | -$833M | -20.69% |
| ITB | Home Construction | -$387M | -6.10% |
| ARKF | Fintech | -$208M | -6.44% |
| BKCH | Blockchain Equities | -$103M | -5.44% |
| ESPO | Gaming & Esports | -$92M | -2.91% |
| PHO | Water | -$73M | -3.10% |
| PEJ | Leisure & Entertainment | -$16M | +12.55% |
Year-to-date allocations continue to favor semiconductors, infrastructure, copper miners, global infrastructure, AI, gold miners, solar, and midstream energy. The largest persistent outflows remain concentrated in China internet, home construction, fintech, blockchain equities, gaming, and water.
Sources
Kaleidoscope Thematic Equity Model Rolling Performance & Attribution, July 31, 2026; data from FactSet Research Systems Inc.
ETFThemes.com Thematic Return and Flow Database, July 31, 2026; data from FactSet Research Systems Inc.
Reuters – A brutal week for chip stocks leaves investors questioning crowded AI positioning; used for the July semiconductor selloff, Moonshot AI, and positioning backdrop.
Amazon Investor Relations – Amazon.com Announces Second Quarter Results, July 30, 2026; used for AWS growth, AI and chips run rates, operating income, and free-cash-flow context.
Reuters – Microsoft says cash will keep flowing from AI, July 29, 2026; used for Azure growth, AI monetization, and capital-spending context.
Federal Reserve – July 29, 2026 FOMC Statement; used for the policy rate, economic assessment, inflation language, and three dissents for a rate increase.
U.S. Bureau of Economic Analysis – GDP (Advance Estimate), 2nd Quarter 2026; used for GDP, private domestic demand, investment, and inflation measures.
U.S. Bureau of Economic Analysis – Personal Income and Outlays, June 2026; used for consumer spending, saving, and PCE inflation.
U.S. Census Bureau – New Residential Sales, June 2026; used for housing demand and inventory context.
Reuters – China’s leaders pledge incremental support without broad new stimulus; used for the China internet and policy backdrop.