

As of April 2, 2026
Overview
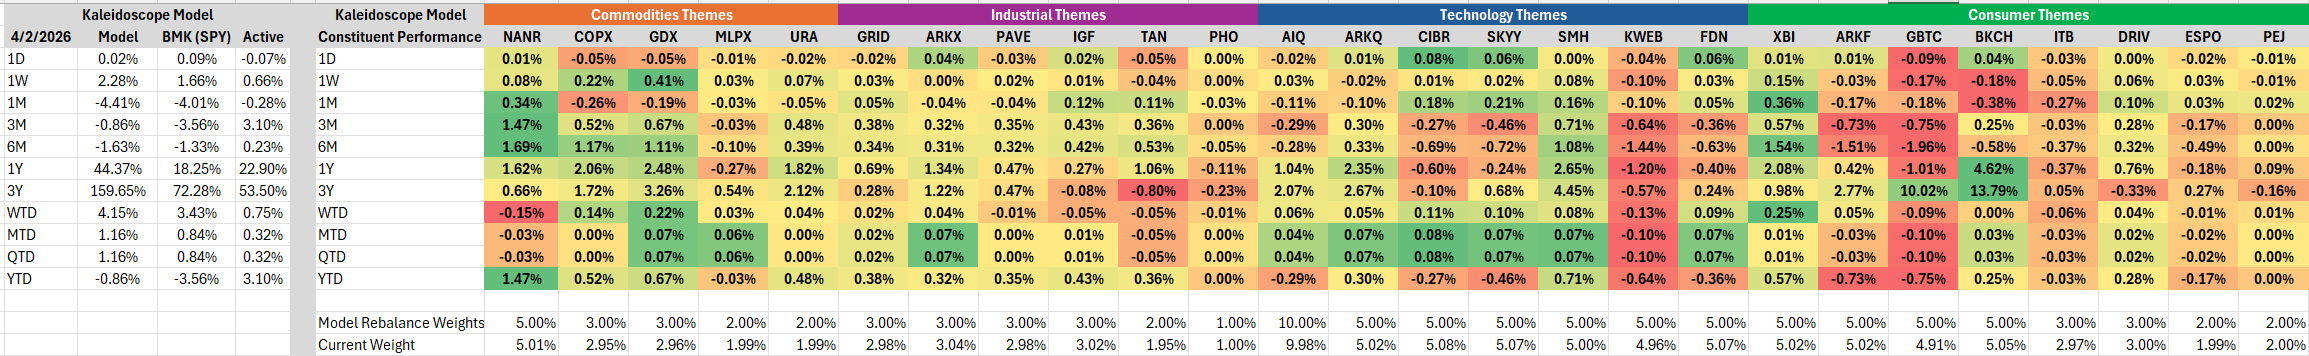
The Kaleidoscope Thematic Equity Model delivered +2.28% over the trailing week, outpacing the SPY benchmark’s +1.66% by 66 basis points. Over the trailing month, the model declined -4.41% versus -4.01% for SPY, a modest -28 bps of underperformance in a broadly difficult tape. Year-to-date, the model has held up meaningfully better, posting -0.86% against SPY’s -3.56%, representing +310 bps of active outperformance.
1-Week Performance (+2.28% vs. +1.66% BMK | Active: +0.66%)
The weekly outperformance was led by the Commodities theme, which contributed the most of any sleeve. Within it, GDX (+0.41%) and COPX (+0.22%) were standout contributors, reflecting continued strength in gold miners and copper producers. NANR (+0.08%) added modestly as well.
On the technology side, GBTC (+0.15%) and SMH (+0.08%) provided meaningful support, while CIBR (+0.01%) and AIQ (+0.01%) were roughly flat. KWEB (-0.10%) and FDN (-0.03%) were the notable detractors within Technology Themes.
Consumer and Industrial themes were largely neutral to slightly positive on the week, with no single holding generating significant drag. BKCH (-0.17%) and DRIV (-0.18%) were the most notable detractors across the book, partially offsetting gains elsewhere.
1-Month Performance (-4.41% vs. -4.01% BMK | Active: -0.28%)
The model’s modest monthly underperformance reflects broad-based pressure on thematic equities, partially offset by standout commodity exposure. NANR was the top single-name contributor at +0.34%, followed by GBTC (+0.36%) and SMH (+0.21%) — notable given the challenging environment for risk assets.
The primary drag came from crypto and digital asset exposure: BKCH (-0.38%), DRIV (-0.27%), and KWEB (-0.17%) all weighed on relative returns. FDN (-0.11%) and ARKQ (-0.10%) were additional headwinds within Technology Themes.
Infrastructure and clean energy holdings — PAVE, IGF, GRID, and PHO — collectively contributed modest positive attribution, demonstrating the defensive character of the Industrial sleeve during the drawdown.
Year-to-Date Performance (-0.86% vs. -3.56% BMK | Active: +3.10%)
The YTD picture is where the model’s thematic construction has most clearly added value. The +310 bps of active outperformance is broad-based but anchored by a few key themes.
Commodities have been the engine of alpha. NANR (+1.47%), GDX (+0.67%), and COPX (+0.52%) together account for roughly 266 bps of positive contribution — reflecting the strong macro tailwinds for real assets and precious metals in 2026.
Within Industrial Themes, URA (+0.48%), GRID (+0.38%), PAVE (+0.35%), and IGF (+0.43%) all contributed positively, underscoring the durability of infrastructure and energy transition plays amid macro uncertainty.
Technology Themes were mixed. SMH (+0.71%) and GBTC (+0.57%) were meaningful contributors, while KWEB (-0.64%), BKCH (-0.75%), and FDN (-0.46%) detracted. XBI (-0.36%) also weighed on the sleeve.
Consumer Themes were broadly a drag: DRIV (-0.17%) and ESPO (-0.03%) were negative, while ITB (+0.28%) and PEJ (-0.17%) offered mixed results.
Portfolio Positioning
The model remains well-diversified across its rebalance targets. Current weights are close to stated targets, with no position deviating materially from its mandate. The largest allocations — AIQ (10%), and a cluster of Technology and Consumer names at 5% each — reflect the model’s thematic breadth. Commodities holdings range from 2–5% individually, collectively forming a meaningful real-asset anchor that has driven the bulk of YTD outperformance.
Key Takeaways: What the Model Signals About the Macro Cycle
The Kaleidoscope model’s return attribution is, in effect, a real-time read on where institutional capital is finding refuge — and what it is avoiding. Taken together, the performance patterns suggest investors are navigating a late-cycle environment defined by three overlapping tensions.
Inflation remains the dominant pricing concern. The sustained outperformance of commodity-linked themes — gold miners (GDX), copper (COPX), natural resources (NANR), and uranium (URA) — reflects a market still pricing elevated and persistent inflation, not a clean return to the Fed’s 2% target. With tariff-driven goods prices keeping CPI above target and the Fed on hold throughout Q1 2026, real assets have functioned as the portfolio’s primary inflation hedge and have been rewarded accordingly. rgimllc.com
The growth narrative is narrowing but not collapsing. Semiconductor exposure via SMH has contributed positively YTD, signaling that investors still believe in the AI infrastructure buildout as a structural demand driver — particularly as energy and power infrastructure themes (GRID, IGF, PAVE) have also delivered positive attribution. The market appears to be discounting a world where AI capital expenditure continues, but the benefits accrue increasingly to physical infrastructure providers rather than pure software or platform plays.
Speculative and rate-sensitive themes are being repriced lower. The consistent drag from KWEB, BKCH, FDN, XBI, and DRIV tells a coherent story: investors are discounting a higher-for-longer rate environment that compresses the valuation multiples of long-duration, cash-flow-distant assets. Chinese internet, genomics, digital consumer, and early-stage fintech all share sensitivity to discount rate assumptions — and their underperformance suggests the market is not yet confident the Fed’s next move is a cut.
Geopolitical risk is being actively priced, not ignored. The strength in gold, commodities, and domestic infrastructure — paired with weakness in globally integrated technology and consumer themes — is consistent with a market embedding a meaningful geopolitical risk premium. Roughly 30% of the S&P 500’s YTD drawdown has been attributed to geopolitical factors, and the Kaleidoscope model’s factor tilts have broadly benefited from that repricing by overweighting real assets and underweighting globally exposed growth.
The consumer is a question mark. Mixed results across ITB, PEJ, and DRIV suggest investors lack conviction on the U.S. consumer’s durability. Housing-adjacent exposure (ITB) has held up, implying continued confidence in household balance sheets, while discretionary spending and mobility themes (PEJ, DRIV) lag — consistent with a consumer increasingly squeezed by tariff-driven price levels and stubborn services inflation.
In aggregate, the model’s 2026 performance paints a picture of a market discounting a mid-to-late cycle slowdown: inflation-resilient real assets outperform, AI infrastructure spending persists as a secular force, but speculative growth and consumer discretionary exposure face a sustained multiple compression that is unlikely to reverse until the Fed’s policy path becomes materially clearer.
Data sourced from Factset Research Systems Inc., ETFAction, capitalflowsresearch.com, rgimllc.com, markets.financialcontent.com
