Kaleidoscope AT enters October fully invested, with a greater emphasis on digital themes following a difficult third quarter. The model selects among the same 26 thematic ETFs held by passive Kaleidoscope, increasing exposure to stronger themes and excluding weaker ones. Passive Kaleidoscope maintains preset weights and rebalances quarterly. AT adjusts its mix monthly and has no defensive overlay.
September performance
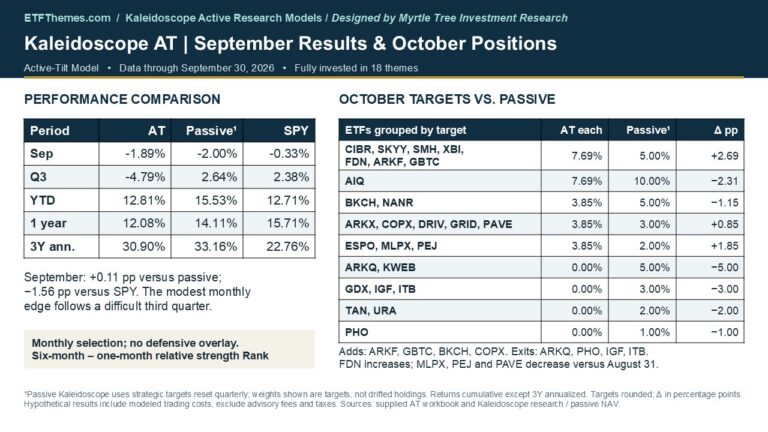
AT declined 1.89% in September, slightly better than passive Kaleidoscope’s 2.00% loss but behind SPY’s 0.33% decline. The model outperformed the passive thematic portfolio by 0.11 percentage point and trailed the S&P 500 proxy by 1.56 points. Strong semiconductor returns helped, but losses across several other favored themes kept the portfolio in negative territory.
| Period | Kaleidoscope AT | Passive Kaleidoscope | SPY |
| September | -1.89% | -2.00% | -0.33% |
| Q3 | -4.79% | 2.64% | 2.38% |
| YTD | 12.81% | 15.53% | 12.71% |
| 1 year | 12.08% | 14.11% | 15.71% |
| 3 years annualized | 30.90% | 33.16% | 22.76% |
Returns through September 30, 2026. Three-year figures are annualized; other periods are cumulative. SPY is the SPDR S&P 500 ETF Trust. Model results are hypothetical.
The quarterly result shows the cost of being in the wrong parts of the thematic universe. AT lost 4.79% in Q3 while passive Kaleidoscope gained 2.64% and SPY gained 2.38%. Because AT remained fully invested, this shortfall reflects its thematic mix and trading costs, not a decision to reduce market exposure.
Year to date, AT gained 12.81%, modestly ahead of SPY’s 12.71%, but behind passive Kaleidoscope’s 15.53%. Over one year, AT returned 12.08%, compared with 14.11% for passive Kaleidoscope and 15.71% for SPY. Its three-year annualized return of 30.90% remains well ahead of SPY’s 22.76%, although it trails passive Kaleidoscope’s 33.16%. The longer record remains constructive, but recent results have not rewarded active selection relative to the passive thematic allocation.
What drove the month
SMH gained 9.41% in September, providing the strongest positive offset among AT’s large positions. CIBR rose 2.94% and AIQ gained 1.34%. Those advances supported the model’s exposure to semiconductors, cybersecurity and AI. In contrast, MLPX fell 8.13%, PEJ declined 5.10% and PAVE lost 4.02%, weighing on the portfolio through energy infrastructure, leisure and infrastructure exposure.
The model also missed GBTC’s 5.85% gain because bitcoin was excluded from the September allocation. GBTC enters the October portfolio, so its September advance should not be credited to AT’s reported return. These figures describe ETF returns and the direction of their impact, rather than exact portfolio contributions.
October positioning and outlook
AT holds 18 of the 26 eligible ETFs for October. Eight top-ranked themes receive 7.69% each, ten receive 3.85% each, and eight are excluded. The largest positions are CIBR, SKYY, SMH, XBI, AIQ, FDN, ARKF and GBTC. Together, they represent 61.54% of the portfolio before rounding.
What changed in the portfolio
ARKF and GBTC enter directly into the largest-position group, while FDN increases from 3.85% to 7.69%. BKCH and COPX enter at 3.85%. MLPX, PEJ and PAVE fall from 7.69% to 3.85%, and ARKQ, PHO, IGF and ITB leave the portfolio. These changes compare the September 30 targets for October with the August 31 targets used entering September.
Against passive Kaleidoscope, AT’s largest overweights are CIBR, SKYY, SMH, XBI, FDN, ARKF and GBTC, each 2.69 percentage points above the passive target. The largest underweights are the excluded ARKQ and KWEB positions, each five points below passive. AIQ illustrates why rankings and active weights need to be distinguished: it is a top-tier AT holding at 7.69%, yet remains 2.31 points below passive Kaleidoscope’s 10% allocation.
Why the signal changed
AT ranks themes by six-month performance relative to SPY, excluding the most recent month. The strongest eight receive twice the equal-weight allocation, the middle ten receive equal weight, and the weakest eight receive zero. The resulting portfolio remains fully invested. The September 30 signal places cybersecurity and cloud computing first and second, followed by semiconductors, biotechnology and AI.
Fintech ETF ARKF improved from rank 20 to 7, and GBTC moved from 24 to 8. FDN rose from 11 to 6. In the other direction, PAVE fell from 8 to 18, IGF from 10 to 21 and ITB from 16 to 22. The rotation therefore favors digital businesses and assets while reducing several infrastructure and housing exposures.
The monthly schedule and omission of the latest month reduce the influence of short-lived price moves. They also mean the model does not simply chase the latest month’s winners. AT has no moving-average exit rule and no automatic allocation to gold, Treasuries or cash. Investors retain thematic market risk even when the ranking process changes the holdings.
October outlook
The portfolio’s central exposure is the durability of digital investment. Semiconductor and AI holdings depend on infrastructure spending translating into revenue and profit growth. Cloud and cybersecurity holdings depend on sustained customer adoption and business spending. Those themes can reinforce one another, but they also share sensitivity to growth expectations and valuations.
New fintech, bitcoin and blockchain positions make financial conditions and investor risk appetite more consequential. Strong earnings and stable financing conditions would support the allocation. Renewed inflation or tariff pressure could challenge margins and raise the return investors demand from growth assets. Smaller infrastructure and leisure positions, along with the removal of homebuilders, reduce some direct exposure to financing costs and consumer demand.
The October test is whether the new mix improves participation in thematic leadership after the weak third quarter. AT will continue to express that view through ETF selection rather than by reducing total exposure. Its role is an active thematic equity allocation, with the potential to outperform passive themes and the risk of falling behind when leadership changes faster than the monthly process.
AT positions versus passive Kaleidoscope
October model target weights based on the September 30 signal. Passive weights are the strategic targets restored at quarterly rebalancing, not estimates of holdings after market drift. Differences are AT minus passive, in percentage points.
| ETF and theme | Kaleidoscope AT | Kaleidoscope Passive | Difference pp |
| CIBR Cybersecurity | 7.69% | 5.00% | +2.69 |
| SKYY Cloud computing | 7.69% | 5.00% | +2.69 |
| SMH Semiconductors | 7.69% | 5.00% | +2.69 |
| XBI Biotechnology | 7.69% | 5.00% | +2.69 |
| AIQ Artificial intelligence | 7.69% | 10.00% | −2.31 |
| FDN Internet | 7.69% | 5.00% | +2.69 |
| ARKF Fintech | 7.69% | 5.00% | +2.69 |
| GBTC Bitcoin | 7.69% | 5.00% | +2.69 |
| BKCH Blockchain | 3.85% | 5.00% | −1.15 |
| PEJ Leisure and entertainment | 3.85% | 2.00% | +1.85 |
| MLPX Energy infrastructure | 3.85% | 2.00% | +1.85 |
| DRIV Electric vehicles | 3.85% | 3.00% | +0.85 |
| ESPO Video gaming and esports | 3.85% | 2.00% | +1.85 |
| NANR Natural resources | 3.85% | 5.00% | −1.15 |
| GRID Smart grid | 3.85% | 3.00% | +0.85 |
| ARKX Space innovation | 3.85% | 3.00% | +0.85 |
| COPX Copper miners | 3.85% | 3.00% | +0.85 |
| PAVE US infrastructure | 3.85% | 3.00% | +0.85 |
| ARKQ Autonomous technology and robotics | 0.00% | 5.00% | −5.00 |
| PHO Water resources | 0.00% | 1.00% | −1.00 |
| IGF Global infrastructure | 0.00% | 3.00% | −3.00 |
| ITB Home construction | 0.00% | 3.00% | −3.00 |
| GDX Gold miners | 0.00% | 3.00% | −3.00 |
| TAN Solar | 0.00% | 2.00% | −2.00 |
| KWEB China internet | 0.00% | 5.00% | −5.00 |
| URA Uranium | 0.00% | 2.00% | −2.00 |
| Total | 100.00% | 100.00% | 0.00 |
AT weights are 7.6923% and 3.8462% before rounding. An exclusion is a zero allocation, not a short position. “Top-ranked” means overweight relative to an equal-weight starting point; the table shows the separate comparison with passive Kaleidoscope’s strategic weights.
Sources and methodology: Kaleidoscope_Selection_Tilt_Model.xlsx through September 30, 2026; supplied September Kaleidoscope research and passive target weights; passive NAV from the supplied TRM workbook. Returns compound daily series over calendar periods. The workbook’s internal equal-weight reference differs from the passive quarterly portfolio shown here. Hypothetical results include modeled trading costs of 15 basis points per unit turnover and exclude advisory fees and taxes. Pre-2022 history uses a theme list chosen later; subsequent history remains in-sample research. Rules were frozen September 28, 2026. Results are not a live account track record. Past performance does not assure future returns.
Disclaimer: This report is provided for informational and educational purposes and is not personalized investment advice or a recommendation to buy or sell any security. Kaleidoscope AT is a research model; reported performance is hypothetical and does not represent actual trading or any investor’s account. Results reflect modeled transaction costs but exclude advisory fees, taxes and additional implementation costs. Historical results incorporate hindsight: the thematic universe was selected at the end of 2021, and model rules were developed using historical data. Backtested performance may differ materially from actual results. The model remains fully invested and can experience substantial losses. Thematic and digital-asset exposures may be concentrated and volatile. Benchmark portfolios differ in composition, risk and rebalancing methodology. Past performance does not guarantee future results.